featured visualizations

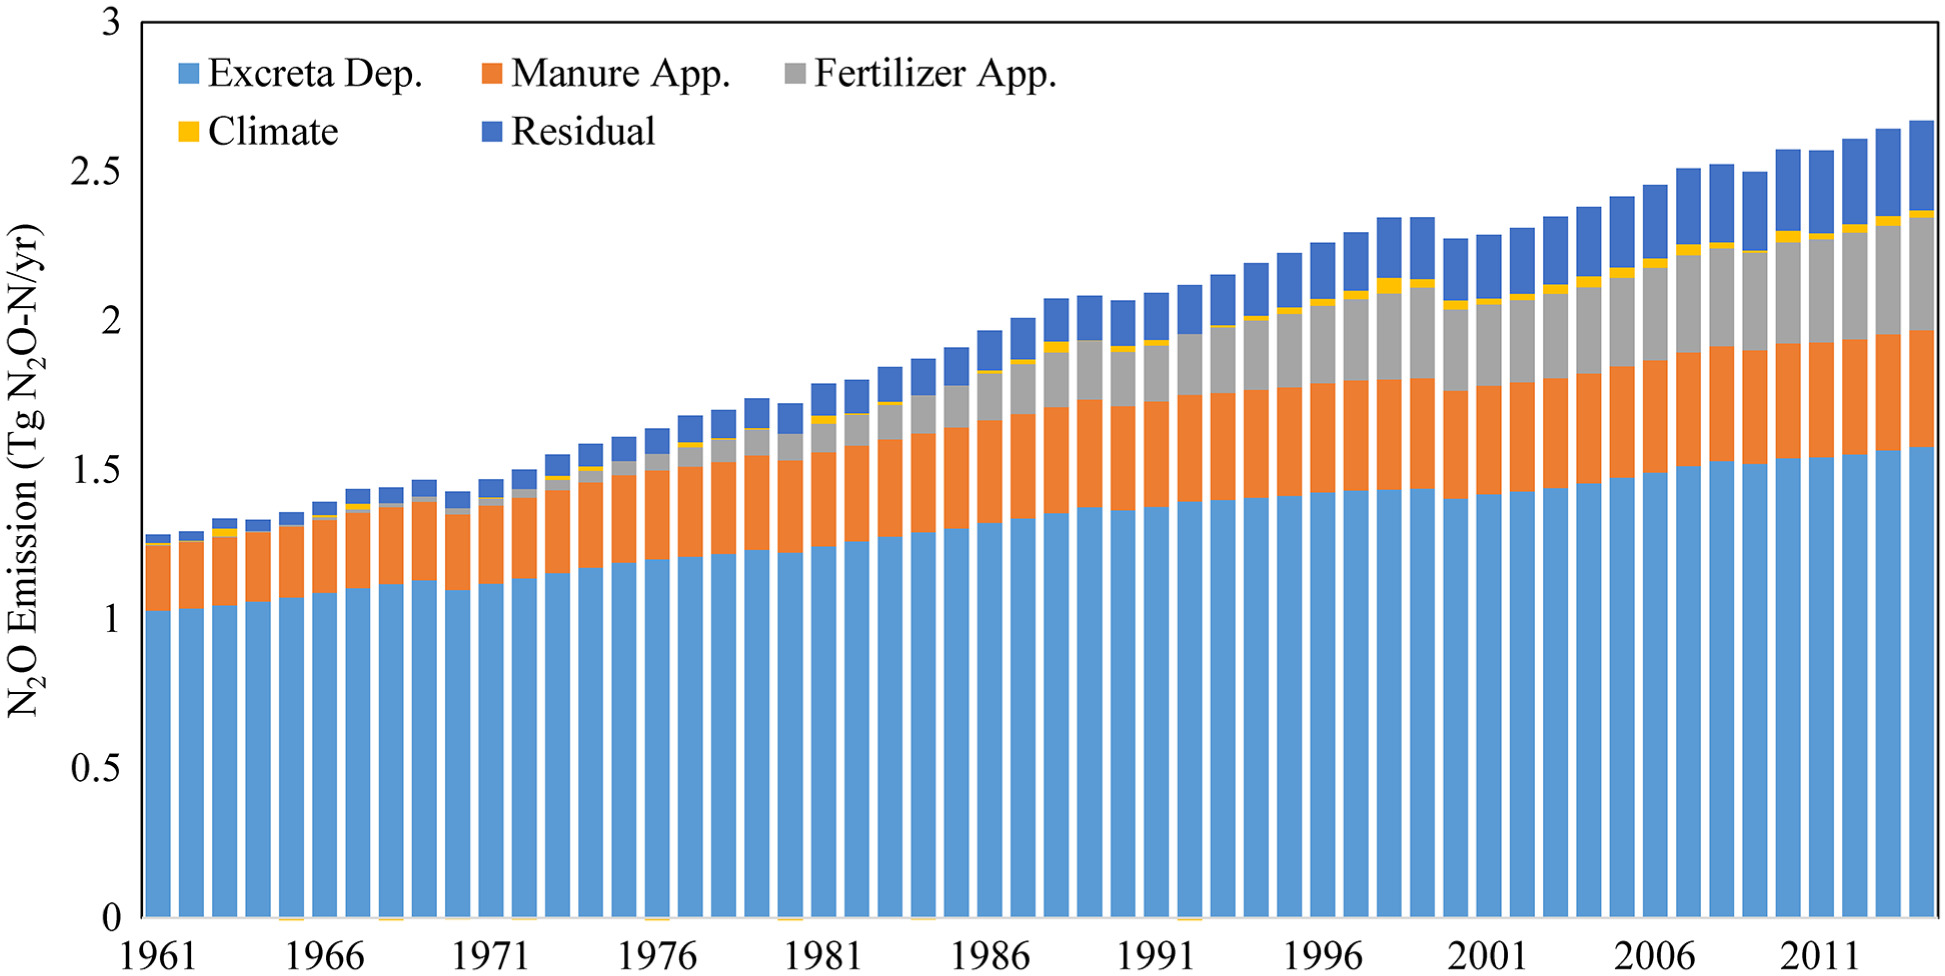
N2O emissions by source, 1961–2014

Stacked bar chart showing rising N2O emissions in the United States from 1961 to 2014, with contributions from excreta deposition, manure and fertilizer application, climate, and residual factors.

Source: Dangal, S. R. S.Tian, H.Xu, R.Chang, J.Canadell, J. G.Ciais, P., et al. (2019). Global nitrous oxide emissions from pasturelands and rangelands: Magnitude, spatiotemporal patterns, and attributionGlobal Biogeochemical Cycles33200222https://doi.org/10.1029/2018GB006091


© 2025 Nitrous Oxide. All rights reserved.
Powered by Archie